Dalliance is a track-oriented genome viewer similar to Ensembl, UCSC, or GBrowse. However, it is a little different in operation because it uses recent extensions to web standards ("HTML 5") to offer a higher level of interactivity than most previous genome viewers. It also uses DAS to collect annotations from around the internet -- which will be important if you want to add custom data to a Dalliance browser.
Before reading on, you might want to click here to open a genome viewer in a new window.
Navigation
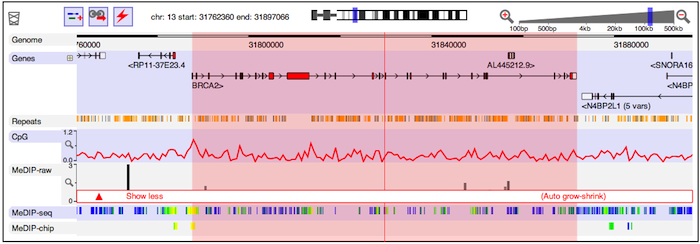
Assuming that all is well, you should see a genome view something like this:
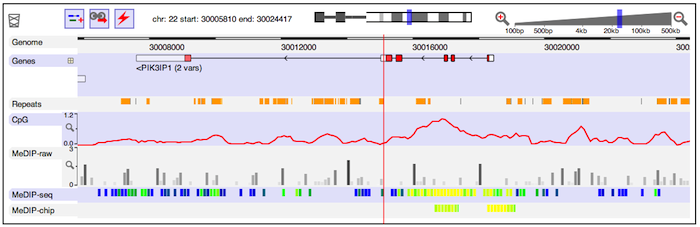
You'll see several distinct tracks of information about the genome. Some, such as the gene structures, are fetched from servers operated as part of the Dalliance project. Others come from elsewhere -- for instance, DNA methylation data hosted at EBI.
To move around, point at the blue background of any of the tracks, hold down the left mouse button, and drag. Alternatively, if your input device supports panning gestures, you can use these instead (e.g. with an Apple Magic Mouse, moving one finger horizontally across the top surface of the mouse will scroll).
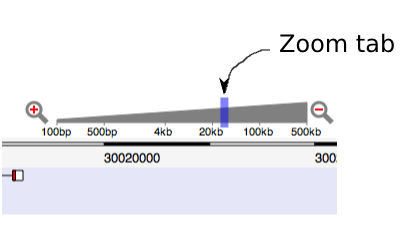
You can scroll in or out by dragging the tab on the zoom slider:
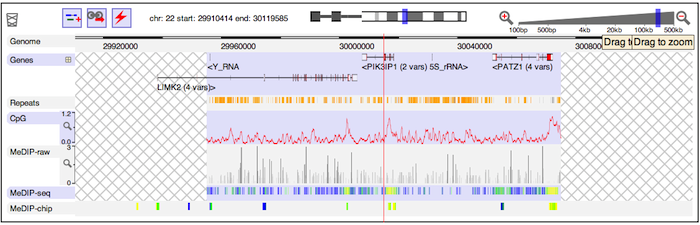
If you rapidly zoom out, you may see a cross-hatched background. This indicates that data currently hasn't been fetched for a region. Wait a moment and the hatched regions will be replaced by genome annotation.
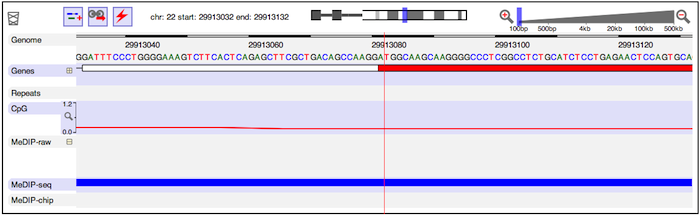
If you zoom in far enough, you will eventually see the base-pair-level genome sequence. In the example below, you can see the ATG start codon of the protein-coding part of a gene.
As you zoom in and out, notice that any feature directly underneath the red guideline remains centred. You can double-click on any feature to center it, then zoom in to find other features which might be aligned with it. For larger features, you can also double-click close to the edges of the feature to center that edge.
Searching
To jump to specific coordinates, or search for a named feature, click on the location label: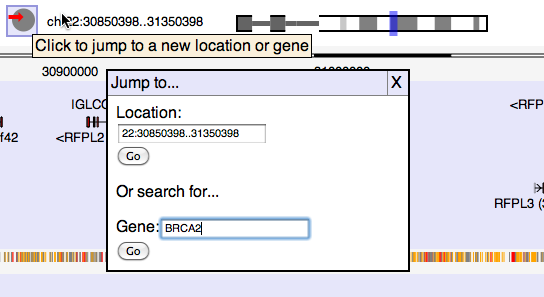
If a named feature can be found in the DAS system, it will be highlighted in the browser, e.g.:
NB feature search currently has a few limitations. Most significantly, gene names are cases sensitive (which means you need to search for "BRCA2" in human but "Brca2" in mouse!), and the system deals badly with searches which match to more than one region of the genome. We're very keen to improve this aspect of the system in the future.
Customizing your display
Some types of track have a customization button in their name-tab. Genes and some other "region" tracks have an expand/collapse button:
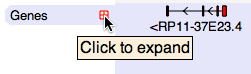
In the case of gene tracks, expanding will show all the annotated splice variants.
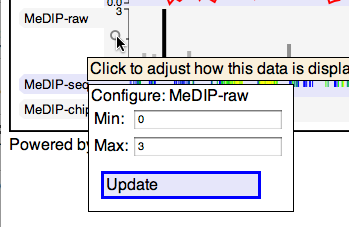
Quantitative tracks can be configured by clicking on the magnifying glass, for instance to adjust the y-axis scale:
You can change the order of tracks by dragging their name-tabs and dropping them elsewhere in the browser display:
You can also delete a track by dragging its name-tab to the waste bin.
Adding new tracks...
If you delete important tracks or otherwise get the browser into a state you don't want, just hit the "reset" button in the toolbar.
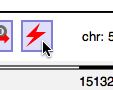
Exporting images
Click the export button to save the current browser state in either SVG or PDF format:
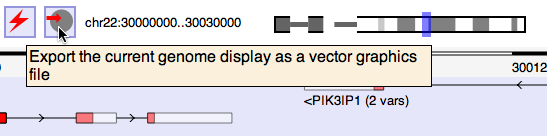
SVG format is good if you want to add additional graphics elements using tools like Inkscape. PDF is generally best for use in publications and presentations. Note that although the SVG export view is generated by the Dalliance code running in your web browser it is currently (December 2010) not practical for a pure browser-based application to save files to local storage unless they have been downloaded from a server. Therefore, the SVG data is sent to a server then immediately returned (we hope this will change in the future). PDFs are generated on the server using Apache Batik.
Tips and tricks
- You can also perform basic navigation using the keyboard (arrow keys to scroll, shift-arrow to scroll fast, +/- to zoom).
- Tap SPACE to toggle between two different zoom levels. By default, the secondary zoom level is set to base-pair resolution.
- Tap RETURN to dismiss all currently-visible "expand/collapse track" warnings.
- Tap 'T' to expand or collapse gene structures.